This past week I’ve wrapped up a many-month company-wide transformation project. My role is that of project manager, but with fewer gannt charts. I’ve been responsible for coordinating every team to migrate customers from aquired technology across to our in-house system.
This is not a comfortable experience for customers.
Customers who use their decade-old web interface on Friday turn up on Monday to a completely new experience. No matter how many emails, videos and webinars we produce everything they are comfortable with has changed completely.
But how uncomfortable are they? When we planned this project we decided to measure their satisfaction on the old system and then on the new system using the same metric.
To measure customer satisfaction, we decided to use NPS — Net Promoter Score. I’m a big fan of NPS. It’s a very effective tool for quickly measuring customer satisfaction. Long surveys are rarely scientific and the self-selection rate (how many people elect to take part) and the abandomment rate (how many people don’t complete the survey) are abysmal. But NPS is a single question: How likely are you to recommend X to a friend or colleague.
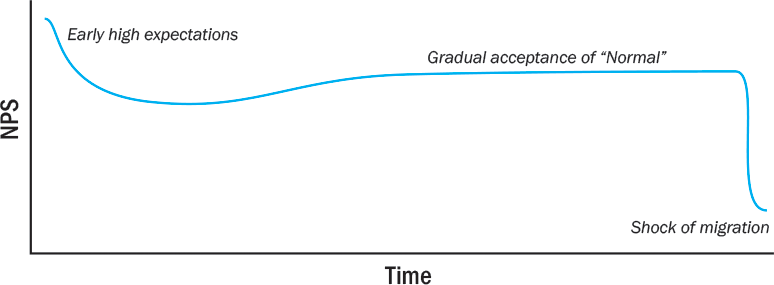
For a couple of months prior to migrating customers to the new platform we used an in-app NPS survey. This is our baseline. It shows how satisfied people are with the current system. But is this useful? After all, a customer that’s been using a terrible platform for a decade is used to the quirks and, for them, the interface is “normal”. Everything is where they expect it every day.
Then we migrated them all across to the new interface. We haven’t asked yet, but last time we did this the NPS dropped through the floor. Quirks that everyone had become used to over the past years no longer exist. Menus are rearranged and everything “just looks different”. For a service that is only a small part of our customers’ lives, we’ve made things a lot harder. Here’s what we saw:

Uh oh. That looks like a compete failure. Our customers now hate us. They may consider moving to a competing service.
So let’s talk about French Fries
In 1954 Ray Kroc discovered the McDonald brothers in San Bernardino in California. His focus on “the system” led him to obsess over the humble french fry. It had to be crisp and golden on the outside and fluffy on the inside. To achieve this he went as far as “curing” potatoes in his basement to properly develop the starches. But the biggest problem was how to cook them in every restaurant so they would be exactly the same.
He tried the obvious: making sure the oil was the perfect temperature and the fries were in for the exact same amount of time, but how many fries were in the basket, the age of the oil, the season of the year, or even the batch of oil could result in a completely different result. As anyone that’s been to McDonald’s more than once can tell you, he found the answer. So how did Kroc perfect the french fry?
The answer was less about the starting temperature and all about recovery time. When you dump frozen fries (or even par-cooked fries) into boiling oil, the temerature will immediately drop. Krok discovered that the perfect fry came out of the oil when the temperature had recovered three degrees from the drop temperature.
No matter how old the potatoes or oil, no matter how many fries, you just had to measure the temperature and pull them out when it rose three degrees.
Fascinating, but how does this apply to the migration project?
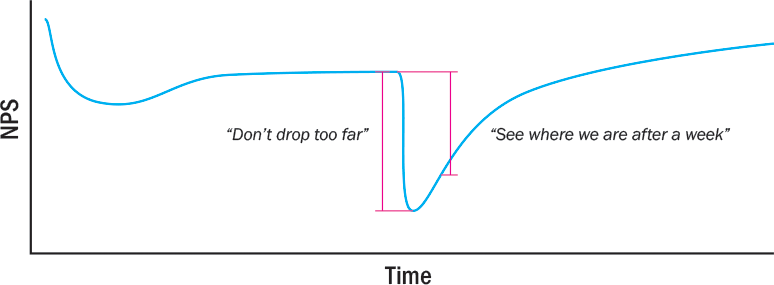
I’m sure you’ve caught on, but if not, here’s my insight: Measuring NPS before and after migration isn’t the key. Two common measurements are illustrated below.

If we say “Don’t drop too far” then we’ll need to spend forever preparing customers or changing the new product so it’s just like the old one. It’s either expensive or pointless. To be worth migrating customers we need to accept that there will be a large drop. Knowing this, it’s very common to think “let’s see where we are after a week”. But this again is a vertical measurement, comparing the old system to the new system. You’re just assuming that a week (or a month) will be enough time for customers to reach a “new normal”. In most cases, the new normal is far into the future.
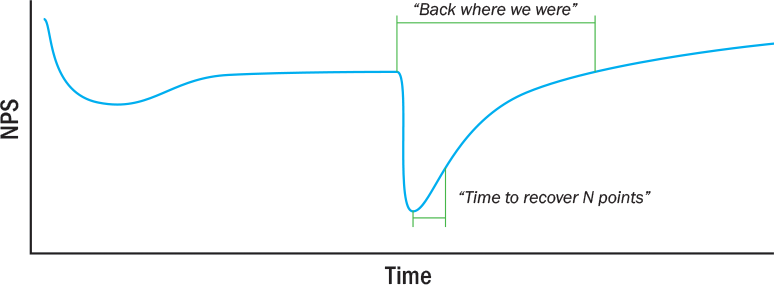
Instead, I’d propose that a better measurement is how long it takes to reach a particular point. How long does it take to come back up three degrees? These are horizonal measurements.

What we care about is recovery time. There will always be a shock in migrating customers to a new platform, and it could be a greater shock for older customers and a lesser shock for newer customers. But what matters is recovery time.
I want to propose two measures: The first one is the “three degrees” measurement. We set ourselves a goal before migration, before we know how far we will drop, and then work to meet that goal that as quickly as possible. In fact, it doesn’t even matter what the old score was. All we care about is lifting our score X points after the first measurement. This means we involve everyone from customer care, to support, to finance and tech to delight the migrated customers. It doesn’t matter how far we dropped, what we want to know is how quickly we can recover.
The longer term measurement is “back where we were”. If anyone is thinking this will be days or even weeks for a platform that’s existed for a decade they have rocks in their head. This is something you talk about in a company report in a year or two from now. This long-term measurement is how you compare your ability to migrate a platform.
Both horizontal scores are excellent for comparing migrations when you have many legacy and aquired platforms with thousands of users to migrate.
To summarize
We don’t need to stop NPS from dropping. Seeing where we are after a week is just a stepping stone. What matters is watching that short-term recovery score that you decided before you began the work. I can’t tell you what your “three degrees” score is. Unlike Kroc I can’t migrate hundreds of baskets of fries to measure the perfect result. But I’m convinced that the important part of the graph isn’t the drop, but how quickly we recover.
Want to reply? I’d love to hear what you think. Join the discussion on LinkedIn.
